Your Portfolio.
Visualized & Mastered.
Track holdings, analyze performance with institutional-grade metrics, and discover the market's top performers. All in one sleek dashboard.
Everything you need to outperform
Stop using spreadsheets. MomentumX brings automated tracking, live market data, and powerful visualizations together.
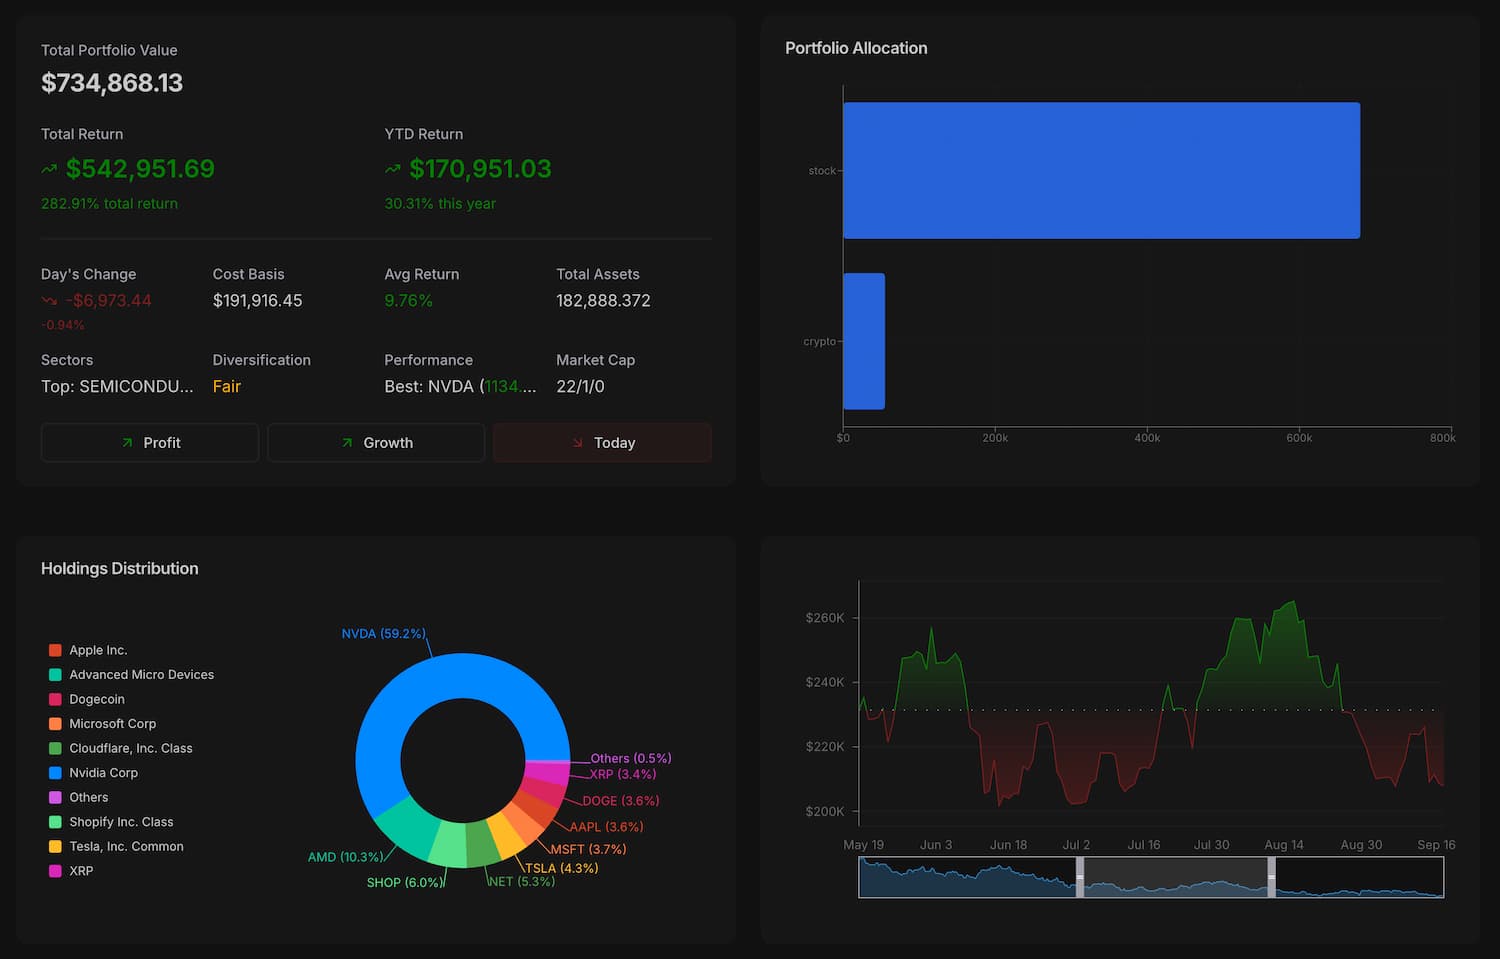
Real-time Performance Tracking
Visualize your Total Return, YTD Return, and Daily Changes instantly. We calculate Cost Basis and Average Return automatically so you know exactly where you stand.
Alpha Discovery
Filter the noise. See lists of the best performing stocks over the last year (TTM or CAGR) to find your next winner.
Deep Allocation
See your diversification at a glance. Sector breakdowns, crypto vs stock splits, and visual holding distributions.
Detailed Company Analysis
Access 52-week ranges, market cap, volume data, and write private comments on specific tickers to journal your thesis.
Ready to take control?
Join thousands of investors tracking their way to financial freedom with MomentumX.
No credit card required for demo mode.